Neural Mechanisms of Social Cognition and Decision-Making
Large-Scale Functional Connectivity Patterns Underlying Common Sense Perception (Behavior & fMRI study)
-
Investigated the neural mechanism underlying the process of judging whether a certain behavior or knowledge is common sense or not
-
Incorporated two different decision contexts involving different cultural perspectives for making common sense judgments to account for the social variability of the judgments
-
Demonstrated that common sense judgment requires integrated neural involvements of a general memory retrieval network and social-affective regions, which include the amygdala, ventromedial prefrontal cortex, medial temporal lobe, angular gyrus, and hippocampus
**Published**
Ahn, J*., Kim H*., Park, J., & Han, S. (in press) Interactivity of neural representations for perceiving shared social memory, Korean Journal of the Science of Emotion and Sensibility, 21(3)
Abstract
Even though the concept of “common sense” is often taken for granted, judging whether a behavior or knowledge is common sense actually requires a complex series of mental processes. Additionally, having different perceptions of common sense causes social conflicts. Thus, it is important to understand how we perceive common sense and make relevant judgments. The present study investigated the dynamics of neural representations underlying the process of judging what common sense is. During functional magnetic resonance imaging, participants indicated the extent to which they thought a given sentence corresponded to common sense under the given perspective. Here, we incorporated two different decision contexts involving different cultural perspectives for making common sense judgments to account for the social variability of the judgments, an important feature of common sense judgment apart from logical true/false judgment. Our findings demonstrated that common versus non common-sense perception requires the neural involvement of the amygdala and a brain network for episodic memory recollection, which includes the hippocampus, angular gyrus, posterior cingulate cortex, and ventromedial prefrontal cortex, suggesting an integrated affective, mnemonic, and social functioning in common sense processing. Furthermore, functional connectivity multivariate pattern analysis revealed that the interactivity among the amygdala, angular gyrus, and parahippocampal cortex reflected representational features of common sense perception and not those of non common-sense perception. Our study demonstrated that the social memory network is exclusively involved in processing common sense and not non common-sense. The results suggest that intergroup exclusion and misunderstanding can be reduced by experiencing and encoding long-term social memories about behavioral norms and knowledge that act as common sense of outgroup.
Main Figures
Experimental task
Participants were asked to indicate the extent to which they thought a given sentence corresponded to common sense under a given perspective (Korean or American) using a 7-point scale (1 = not at all, 7 = absolutely). For the true/false judgment task, participants reported the extent to which they thought the given sentence was true regardless of the perspective for judgment using the same scale.
functional connectivity MVPA Results
Common vs. non common-sense classification accuracy (y-axis) changed by the number of features (x-axis) accumulated. The peak accuracy was 96% when 72 features were included. The results of permutation tests are demonstrated by the dashed bar.


Psychophysiological Interactions (PPI) Results
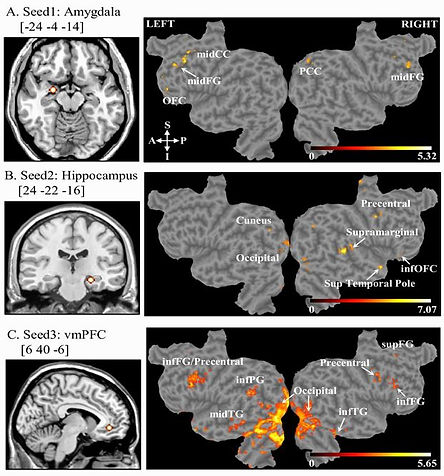
(A) Cortical regions covaried with the left amygdala seed region (left) while perceiving common sense sentences are demonstrated in flattened brain images. The posterior cingulate cortex (PCC), orbitofrontal cortex (OFC), middle frontal gyrus (midFG), and middle cingulum cortex (midCC) were functionally synchronized with the left amygdala along task conditions.
(B) The right hippocampal seed region was synchronized with the supramarginal gyrus, inferior orbitofrontal cortex (infOFC), precentral gyrus, and occipital lobe.
(C) The ventromedial prefrontal cortex (vmPFC) seed region showed synchronization with the parahippocampal cortex, posterior hippocampus, infFG, precentral gyrus, superior frontal gyrus (supFG), inferior parietal gyrus (infPG), middle temporal gyrus (midTG), and occipital lobe.
Centrality of fcMVPA nodes included in the production of peak classification accuracy
We extracted a task-based time series of 86 nodes predefined from the general linear model analysis. Next, we investigated patterns of condition-dependent functional connectivity that sensitively categorize the dynamic of common sense perception from the perspective of multivariate machine-learning classification. For common vs noncommon-sense discrimination, peak accuracy reached 96% when 72 functional connectivity features were included in the iterative classification methods; the accuracy gradually decreased to 23% when all features were included. That is, the inclusion of irrelevant features decreased classification performance. The functional links mainly included the following brain region pairs: left angular gyrus–left amygdala, left precuneus–left superior parietal gyrus, and left amygdala–right middle temporal gyrus.
(A) Normalized betweenness centrality values of nodes that discriminated common vs non common-sense with the highest accuracy are visualized in circles. The size of each circle is proportional to the centrality value (bigger size = bigger value). The line refers to whether a connection existed between two nodes. Node labels are named after the AAL: the brain region (i.e., angular, middle temporal gyrus, superior parietal gyrus), laterality [left (L) or right (R)], and assigned number of nodes in case there is more than one in the same region (i.e., 1, 2, 3…) (i.e., Angular_L_2).
(B, D) Normalized degree centrality values are summarized in the bar graph in the descending order.
(C) Normalized degree centrality values of nodes are visualized in circles. The almost identical pattern of two independent centrality networks is shown.